The national ballot shows where each party’s parliamentary vote came from. A second ballot, cast at the same time, chose the provincial legislatures. The two should not be mixed up.
The names on the 1994 returns
The interim constitution created nine provinces out of the Cape, Natal, the Transvaal, the Orange Free State, and the homelands. Some of the names used on the 1994 returns were later changed. This page uses the 1994 name first.
Province names at the election, and the names used now.
On the 1994 returns
Name now
Eastern Cape
Eastern Cape
Eastern Transvaal
Mpumalanga, from 1995
KwaZulu-Natal
KwaZulu-Natal. Some returns wrote “Kwazulu Natal”, and the constitution’s seat schedule still said Natal.
Northern Cape
Northern Cape
Northern Transvaal
Northern Province from 1995, then Limpopo from 2003
North West
North West
Orange Free State
Free State, from 28 June 1995
PWV (Pretoria-Witwatersrand-Vereeniging)
Gauteng, from 28 June 1995
Western Cape
Western Cape
Share of the national ballot
These are votes for the National Assembly, counted in the province where they were cast. A voter was not tied to a home district, so this is a map of where ballots were put in the box, not a perfect census of residents. The three columns are the parties that won seats nationally in more than one region. Everyone else is in the remainder.
National Assembly ballot by province, 26–29 April 1994. Percentages are of valid votes in that province. The nine valid-vote totals sum to 19,533,498.
Province in 1994
Valid votes
ANC
NP
IFP
Leading party
Eastern Cape
2,857,710
84.39%
10.60%
0.24%
ANC
Eastern Transvaal
1,309,993
81.87%
10.27%
1.59%
ANC
KwaZulu-Natal
3,750,606
31.61%
15.76%
48.59%
IFP
Northern Cape
404,579
49.81%
41.94%
0.47%
ANC
Northern Transvaal
1,919,790
92.73%
3.64%
0.15%
ANC
North West
1,588,255
83.46%
10.10%
0.45%
ANC
Orange Free State
1,368,251
77.42%
14.53%
0.62%
ANC
PWV
4,208,301
59.10%
27.58%
4.13%
ANC
Western Cape
2,126,013
33.60%
56.24%
0.65%
NP
The underlying votes, not only the percentages, are in the source note. They reconcile to the national party totals for the ANC (12,237,655), the National Party (3,983,690) and the IFP (2,058,294).
Who won the provincial legislatures
Legislature seats came from the provincial ballot, not from the table above. Across the nine provinces, 425 seats were filled: ANC 266, National Party 82, IFP 44, Freedom Front 14, Democratic Party 12, PAC 3, ACDP 3, and the Minority Front 1.
Seats in the provincial legislatures elected in April 1994. A dash means the party did not win a seat there. Premiers took office in May 1994.
Province
Seats
ANC
NP
IFP
FF
DP
Others
Premier
Eastern Cape
56
48
6
0
0
1
PAC 1
Raymond Mhlaba, ANC
Eastern Transvaal
30
25
3
0
2
0
—
Mathews Phosa, ANC
KwaZulu-Natal
81
26
9
41
0
2
PAC 1, ACDP 1, MF 1
Frank Mdlalose, IFP
Northern Cape
30
15
12
0
2
1
—
Manne Dipico, ANC
Northern Transvaal
40
38
1
0
1
0
—
Ngoako Ramatlhodi, ANC
North West
30
26
3
0
1
0
—
Popo Molefe, ANC
Orange Free State
30
24
4
0
2
0
—
Mosiuoa Lekota, ANC
PWV
86
50
21
3
5
5
PAC 1, ACDP 1
Tokyo Sexwale, ANC
Western Cape
42
14
23
0
1
3
ACDP 1
Hernus Kriel, NP
All provinces
425
266
82
44
14
12
PAC 3, ACDP 3, MF 1
The ANC had an outright majority in the Eastern Cape, Eastern Transvaal, Northern Transvaal, North West, the Orange Free State and the PWV. In the Northern Cape it had 15 of 30 seats: the largest party, and able to elect a premier, but not a majority on its own. The National Party had a majority in the Western Cape, 23 of 42. The IFP had a majority of one in KwaZulu-Natal, 41 of 81. On the national ballot in that province the IFP led with 48.59 percent, short of half. The provincial ballot was a little stronger for Inkatha, enough for 41 seats.
Three results that shaped the story
KwaZulu-Natal
The hardest province to bring into the election, and the only one Inkatha won. Frank Mdlalose, a doctor and IFP negotiator, became premier. The ANC, with 26 of 81 seats, entered the provincial executive under the unity rules.
IFP48.59%
ANC31.61%
NP15.76%
Shares of the national ballot cast in the province.
Western Cape
The National Party’s clearest win, 56.24 percent of the national ballot cast in the province and 23 of 42 legislature seats. Hernus Kriel became premier. The ANC was second, on 33.60 percent.
NP56.24%
ANC33.60%
Northern Cape
The closest of the ANC provinces on the national ballot: 49.81 percent to the National Party’s 41.94. In the legislature the ANC had half the seats, 15 of 30, and Manne Dipico became premier.
ANC49.81%
NP41.94%
Northern Transvaal
The ANC’s strongest provincial share on the national ballot, 92.73 percent, and 38 of 40 legislature seats. Ngoako Ramatlhodi became premier. The province was later renamed Limpopo.
ANC92.73%
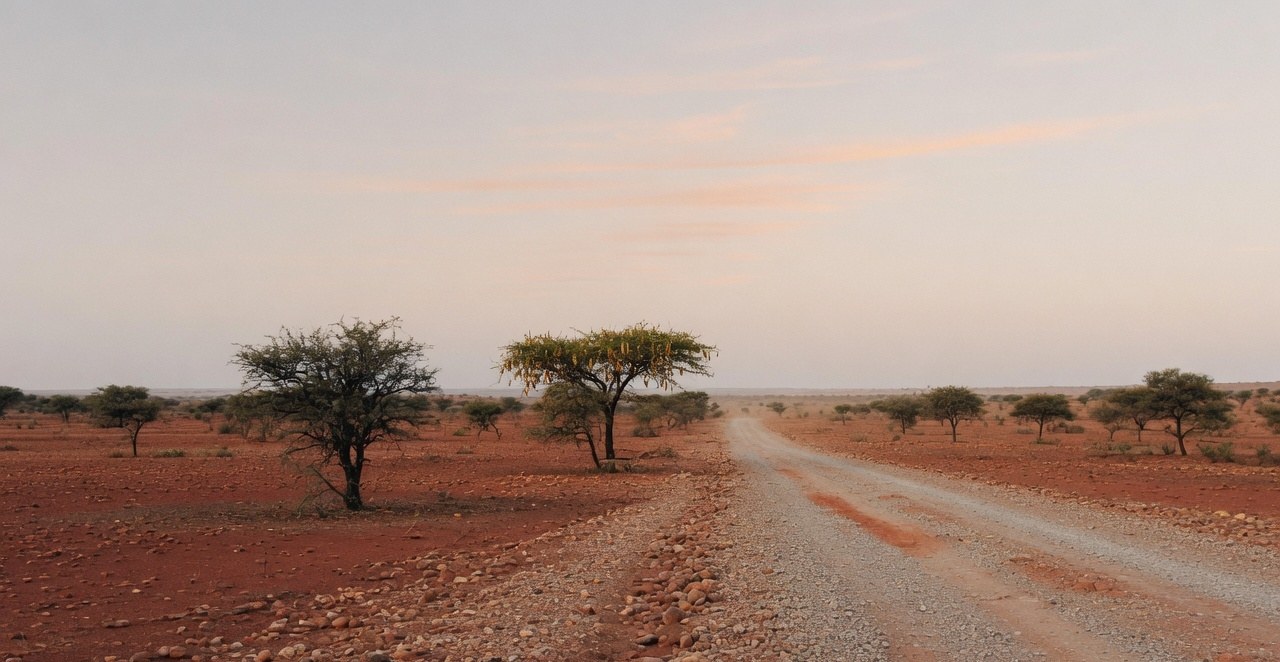
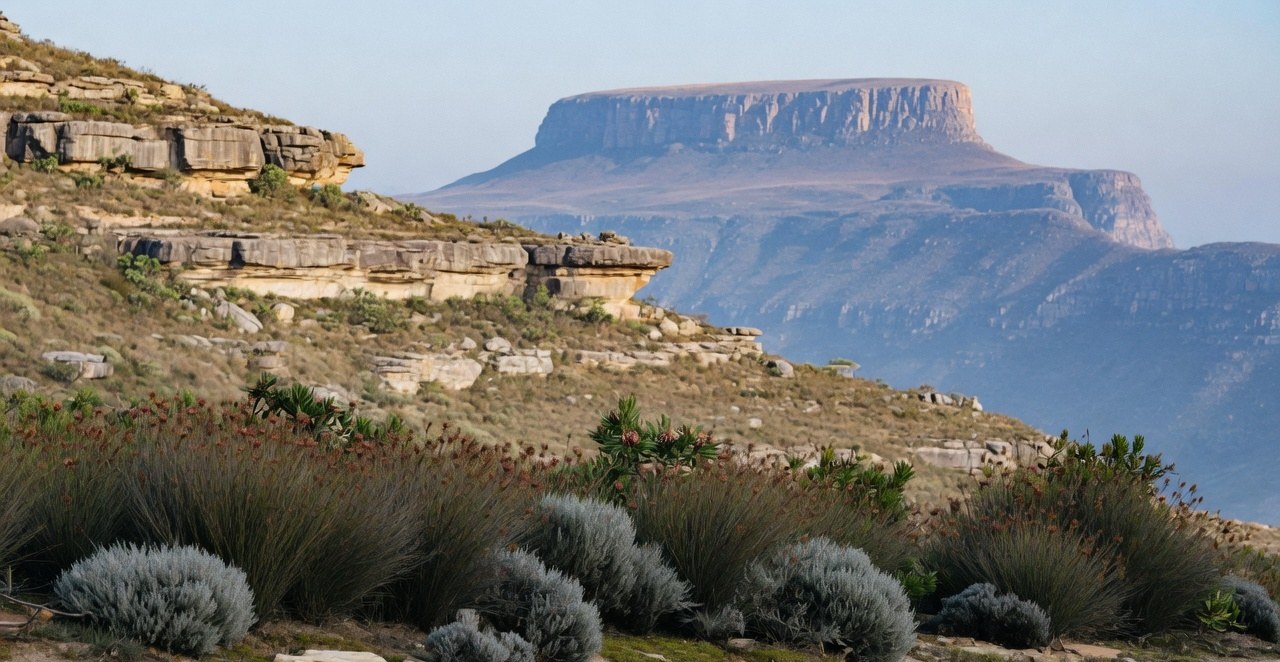
Illustration. The Northern Cape cast the smallest share of the national vote, 404,579 valid ballots, and produced the closest large-party contest.Illustration. The Western Cape was the National Party’s strongest province.